Custom Bookshelf Speaker Design
This project began with my interest in music and my experience upgrading the sound system in my truck. I wanted to design a speaker system that gave me control over every major design decision rather than relying on a prepackaged solution. I started by comparing driver datasheets to select a woofer and tweeter with compatible frequency ranges, sensitivities, and electrical characteristics. I then used WinISD to determine the required enclosure volume and port dimensions. Finally, I modeled the complete system in VituixCAD and refined the passive crossover to create a balanced response between the two drivers.
Enclosure Design
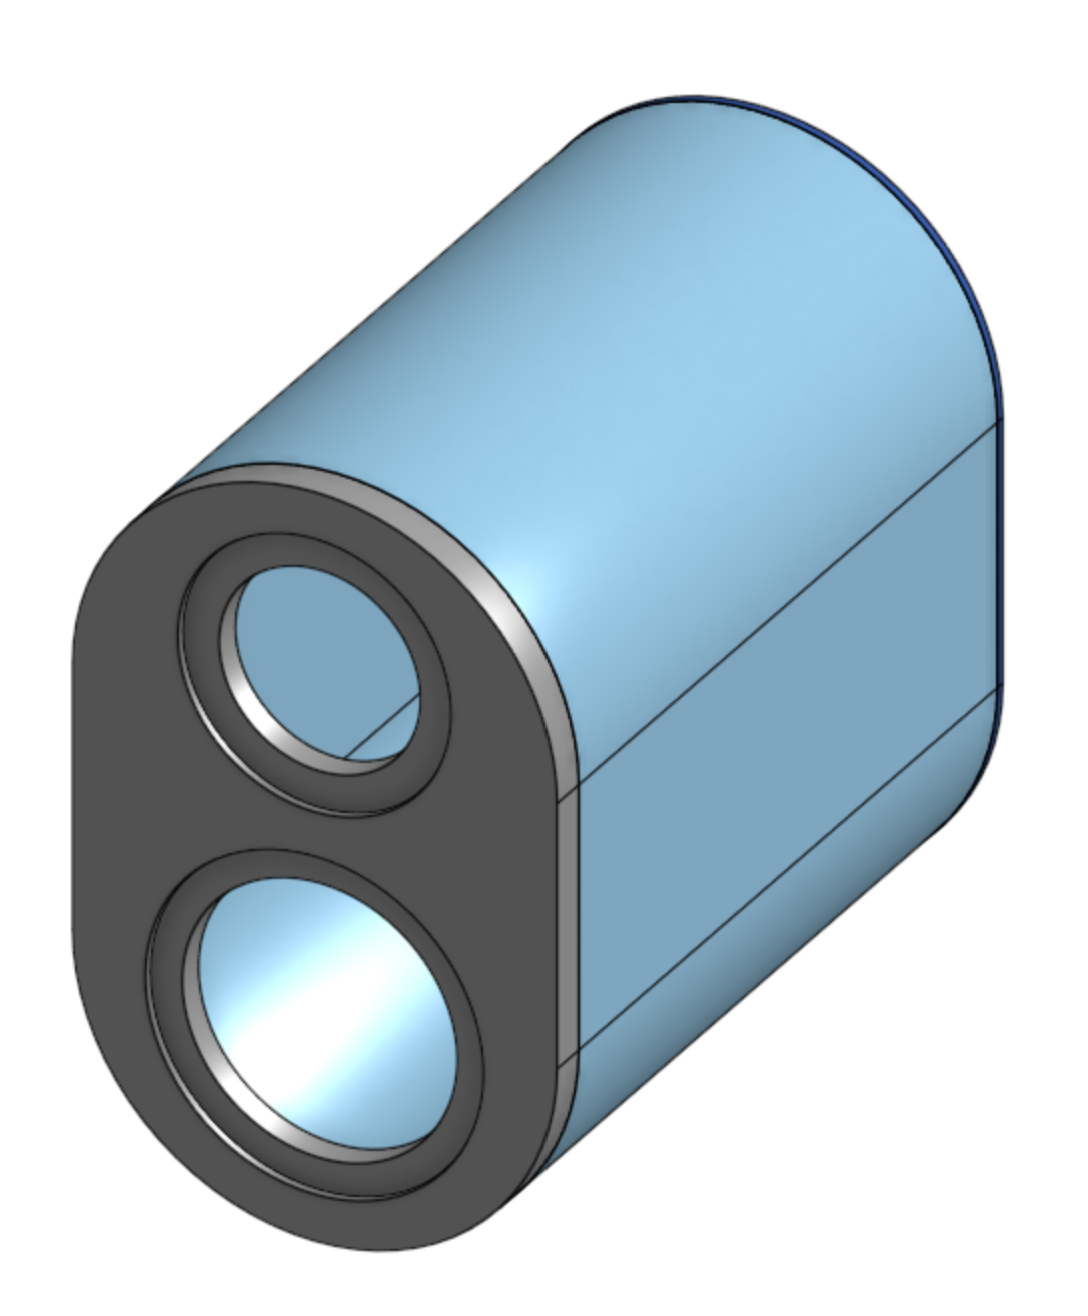
After determining the required internal volume in WinISD, I used CAD to translate the acoustic requirements into the physical enclosure shown here. The woofer and tweeter are arranged vertically on a compact front baffle, while the rounded housing provides the necessary internal space without using a conventional rectangular cabinet. Throughout the modeling process, I balanced driver placement, enclosure volume, component clearance, and the overall appearance of the speaker.
Crossover Design
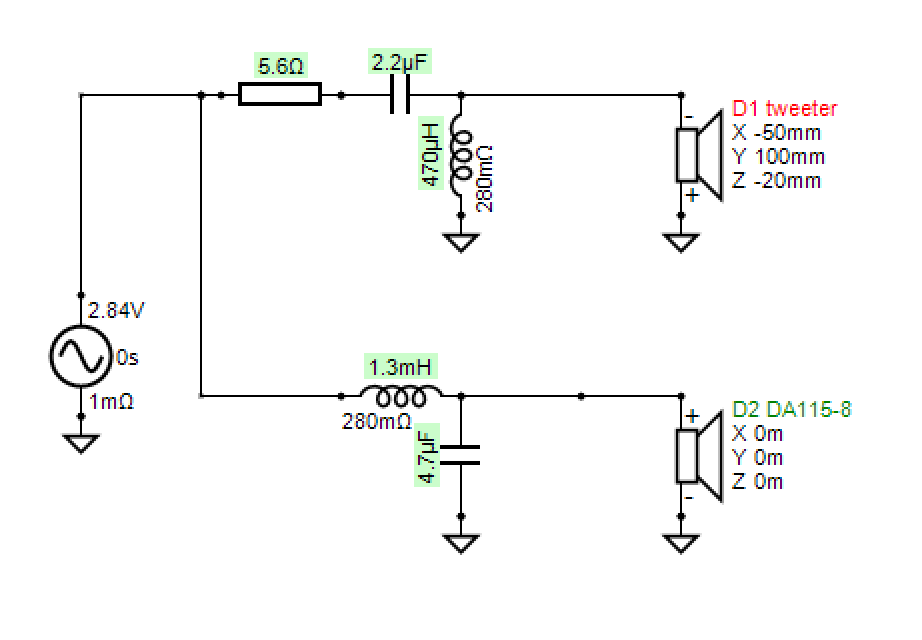
The woofer and tweeter operate most effectively over different frequency ranges, so I designed a passive crossover to divide the incoming signal between them. The woofer circuit uses an inductor and capacitor as a low-pass filter, while the tweeter circuit uses a capacitor and inductor as a high-pass filter. A series resistor reduces the tweeter’s output to better match the woofer’s sensitivity. I adjusted the component values in VituixCAD based on the simulated behavior of the actual drivers, focusing on creating a smooth transition while maintaining a practical circuit.
Simulated Frequency Response
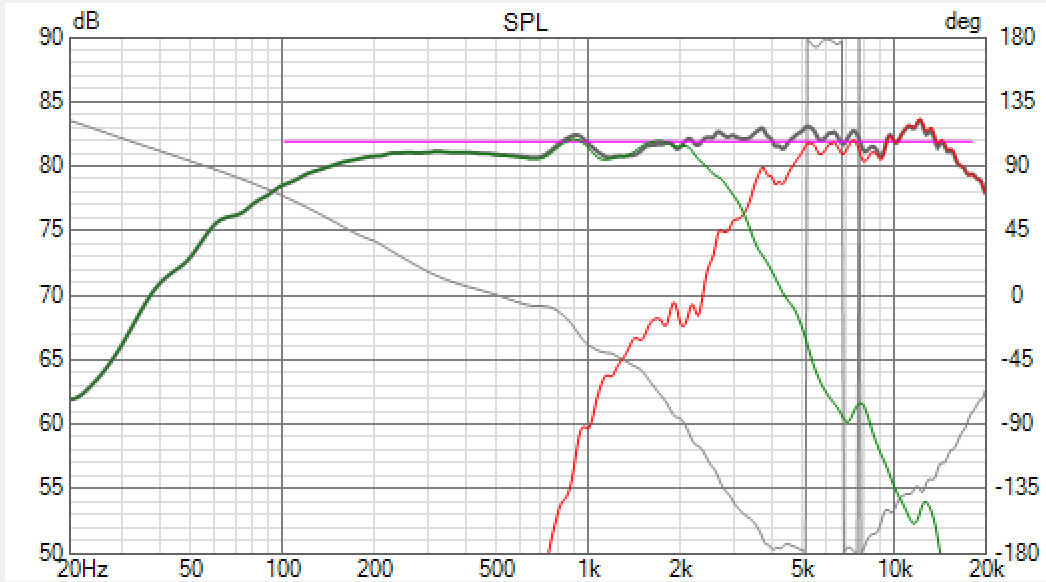
The simulated response plot shows how the two drivers combine after applying the crossover. The green curve represents the woofer, which gradually rolls off as frequency increases, while the red curve represents the tweeter taking over at higher frequencies. The dark combined-response curve remains relatively level through the transition region, indicating that the drivers are contributing without producing a major peak or cancellation. I used this graph to evaluate each crossover revision and adjust the component values until the two drivers produced a balanced overall response.